Goals and Background:
The Goal of this lab is to use different geoprocessing tools for vector analyisis in ArcGIS to find suitable habitats for bears in the study area of Marquette County, Michigan. This lab report contains a final map layout and a data flow model. There are eight objectives listed below:
1. To map a GPS MS Excel file of black bear locations in the study area, central Marquette County, Michigan
2. To determine the forest types where black bears are found in the study area based on GPS locations of black bears.
3. To determine if bears are found near streams.
4. To find suitable bear habitat based on two criteria.
5. To find all areas of suitable bear habitat within areas managed by the Michigan DNR.
6. To eliminate areas near urban or built up lands.
7. To generate a digital data flow model of the workflow and cartographic output.
8. Use some python.
Methods:
Objective 1:
For this objective we unzip the marquette_bear_study file. Then add the bear_locations_geog% to the make, so you can add it as an event theme. Once its in ArcMap, export the data and save it in your lab 3 folder.
Objective 2:
In this objective you add all feature classes in the bear_management_area feature dataset, and change make the landcover symbology a unique color map for the "minor type" field. Now intersect bear_locations and landcover renaming the new feature class bear_cover. Next you summarize the Minor_type field with the FID_bear_locations (Max) and the Area (Max) statistics. Then open the attribute table where you will find the top 3 land covers with the most bears.
Objective 3:
This objective requires you to find out the how many bears are within 500 meters of a stream. In order to figure this out create a query by location. Create a buffer with a buffer with streams and a distance of 500 meters than dissolve the new layer to get one individual polygon. Add bear_locations to target layers, and use the dissolved stream buffer layer as your source layer. You will find that 49/68 (72 percent) of bears are located within 500 meters of streams. Note that the distance of streams is definitely an important habitat characteristic.
Objective 4:
For this objective you need to find suitable areas of bear habitat based on your research. Use the intersect tool, and input for the dissolved stream buffer layer and the suitable land cover top layer. Then dissolve the new layer to clean things up a bit.
Objective 5:
In order to make recommendations to the Michigan DNR for a bear management plan you need to find a bear habitat located in their management lands. Bring in the dnr_mgmt layer from the political boundaries dataset. Again use the intersection with the suitable land area near streams layer and the dnr_mgmt layer. Dissolve the internal boundaries for a better look.
Objective 6:
For this objective you need to find bear management areas that are away from Urban or Built up land. You need to exclude all areas that are within 5 kms of Urban or Built up lands in a 3 step process. First create a query by attribute to select Urban or Built up land then make it it's own layer. Second buffer urban or built up land with a distance of 5 km, and dissolve the boundaries when you're done to get a single polygon. Third and last, use the erase tool to get all of the suitable DNR managed land areas outside of 5 kms from urban or built up land.
Objective 7:
In this Objective you will create a cartographically pleasing data flow model of your workflow from all the steps/tools used as well as a cartographically pleasing map.
Objective 8:
In the final Objective you will work with Python Code.
Results:
Objective 2:
The three most populous land types with bears is listed below:
1) Mixed Forest Land - 31 bears
2) Forested Wetlands - 17 bears
3) Evergreen Forest Land - 14 bears
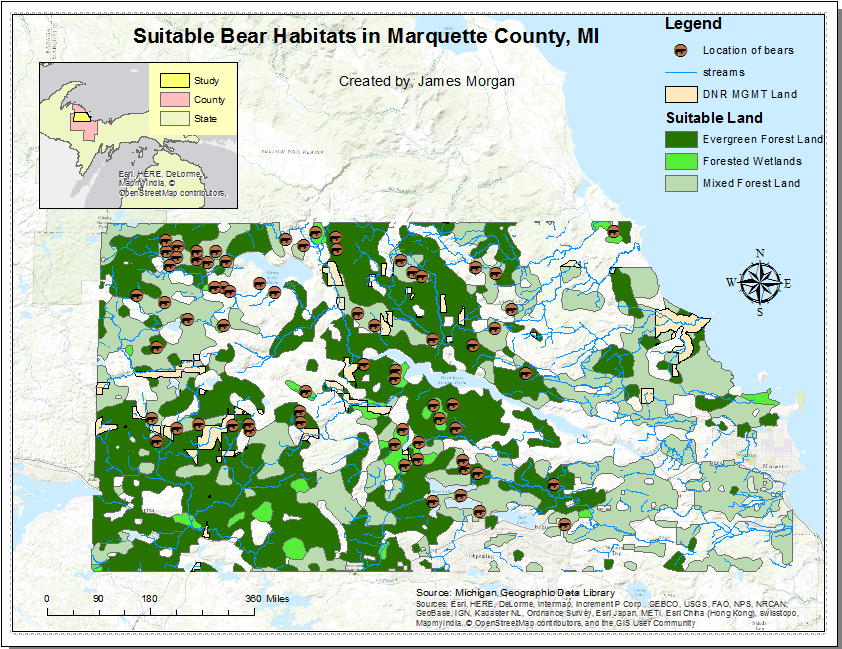
Objective 7:
Your Suitable Bear Habitats in Marquette County, MI should like like Figure 1 below:
 |
| Figure 1 is the Final map you are proposing to the DNR for suitable bear habitats. It includes the location of the bears, streams, the three most populous bear land covers, and the DNR managed land that is more than 5 km from urban or Built-up land. |
Objective 8:
Your Data Flow Model should look like Figure 2 below:
 |
| Figure 2 is a Data Flow Chart of all the functions performed to reach the final product |
Your Python Code should look Figure 3 below:
 |
| Figure 3 shows the Python Code you should have done to introduce yourself to the Python tool |
Sources:
Data Management:
The data for this lab is downloaded from the lab3.zip file.
Data Sources:
State of Michigan open GIS data.
USGS NLCD
DNR Management Unit